
Color palettes for data visualization from Quadram Institute Bioscience.
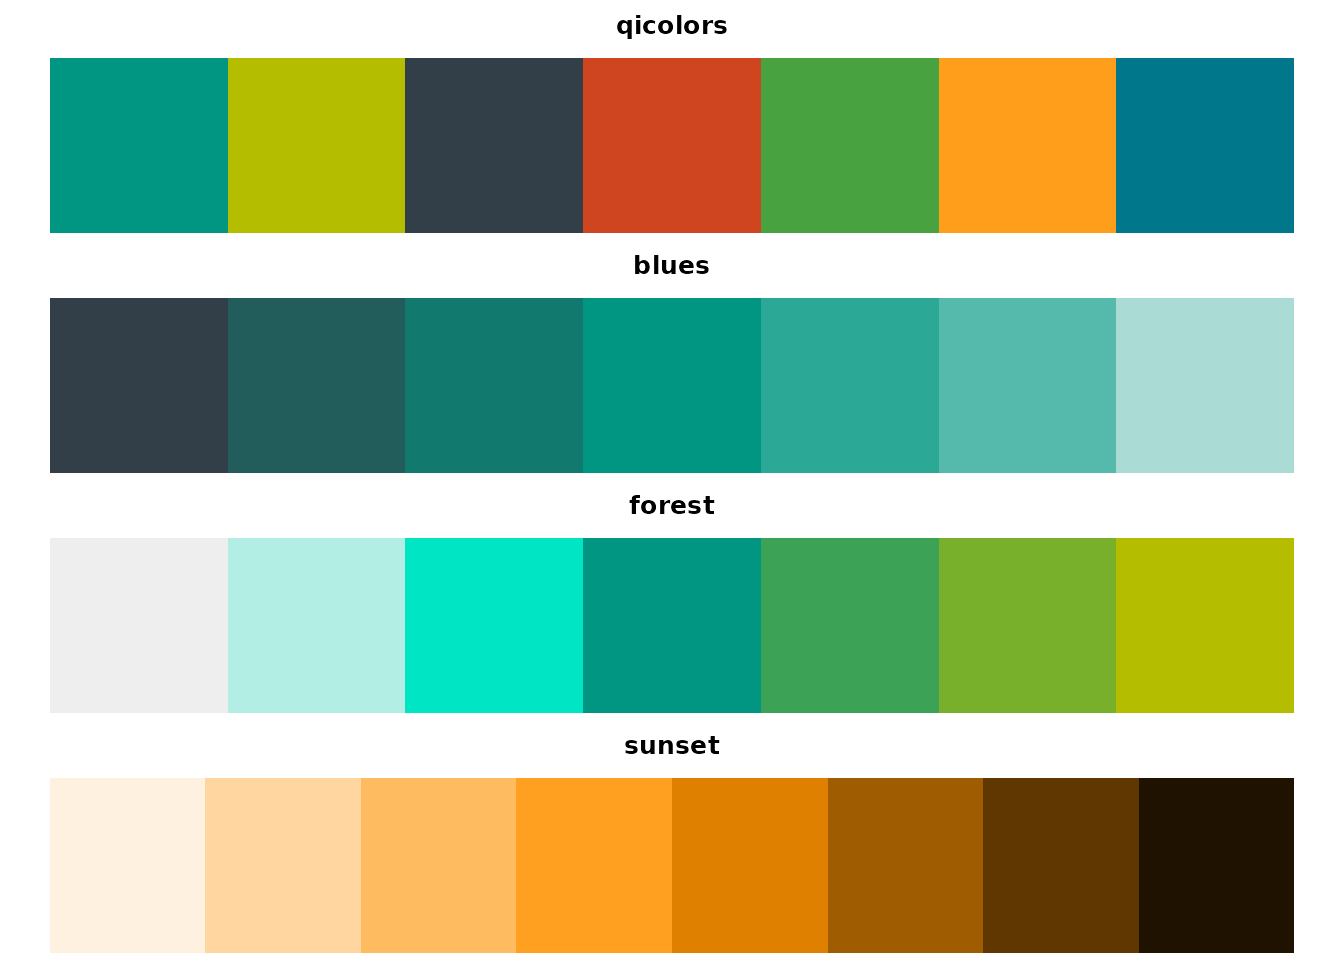
palettes
Installation
# Install from GitHub
devtools::install_github("quadram-institute-bioscience/qipalette")
Usage
library(qipalette)

# View all available palettes
display_all_palettes()

# Get colors from a palette
colors <- get_palette("sunset", n = 5)

# Use with base R
plot(1:5, col = colors, pch = 19, cex = 3)

# Use with ggplot2
library(ggplot2)
ggplot(mtcars, aes(wt, mpg, color = factor(cyl))) +
  geom_point(size = 3) +
  scale_color_palette("sunset")
For more examples, see the package vignette: vignette("introduction", package = "qipalette")
Made with Claude.ai