The course requires reading this notes or watching the introductory lecture (30 minutes):
What is Machine Learning?
Machine Learning (ML) is a subset of artificial intelligence that enables computers to learn and make decisions from data without being explicitly programmed for every possible scenario.
A first example: linear regression
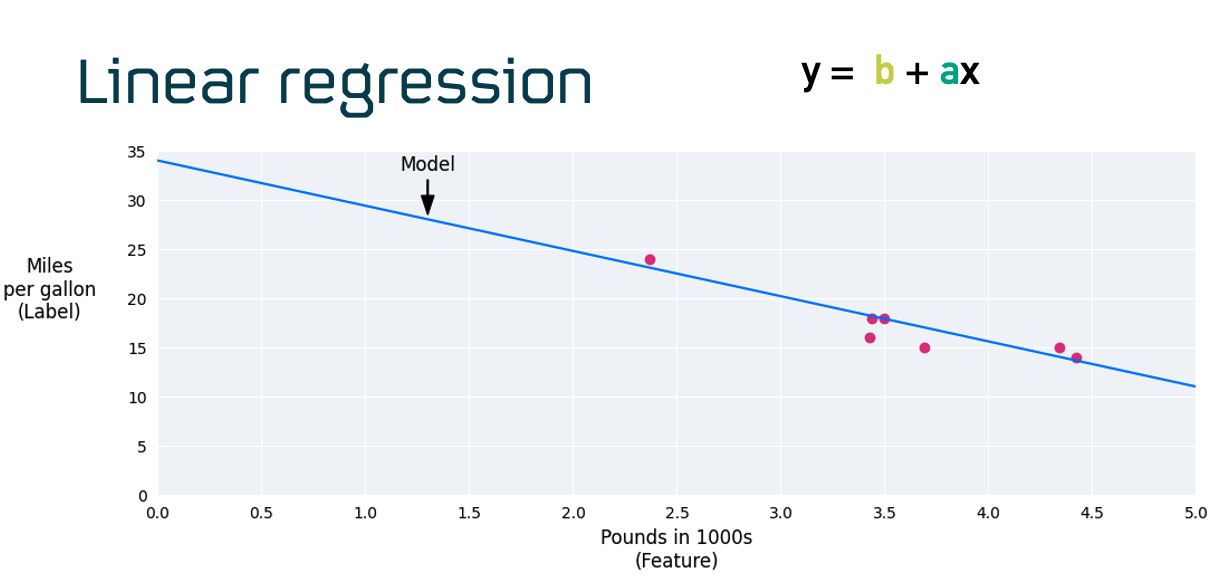
Linear regression is one of the simplest machine learning models. It tries to find the best straight line that fits a set of data points.
In the image (from Google ML training), each pink dot represents a car:
- The x-axis (horizontal) shows the car’s weight in thousands of pounds.
- The y-axis (vertical) shows its fuel efficiency in miles per gallon (mpg).
The blue line is the model. It uses the formula:
y = b + ax
Where:
- x is the weight (input feature),
- y is the mpg (output/label),
- a is the slope (how much mpg changes per unit of weight),
- b is the intercept (mpg when weight is zero).
The goal of the model is to predict mpg given the weight of a car. The line minimizes the overall distance to all the points — making it the “best guess” based on the pattern in the data.
![]() key aspect: we need to know in advance that we have a linear correlation, and the “training” process will find the best values of a and b (weight and bias)
that will allow to make predictions
key aspect: we need to know in advance that we have a linear correlation, and the “training” process will find the best values of a and b (weight and bias)
that will allow to make predictions
![]() read more from the Google Machine Learning crash course
read more from the Google Machine Learning crash course
A more general function: neural networks
Now that we’ve seen how a simple linear model works, we might want something more powerful — a way to learn functions that are more complex than a straight line. Real-world relationships aren’t always linear; they might follow curves, bends, or shapes like parabolas, sigmoids, or something even more intricate.
A neural network is a flexible model designed for this. It’s made up of many simple functions (called neurons) that are connected together. Each neuron on its own performs a very basic computation, often with just one or a few parameters. But when you stack and combine these neurons across layers, the network can learn to represent highly complex patterns — even ones we can’t easily describe with simple formulas.
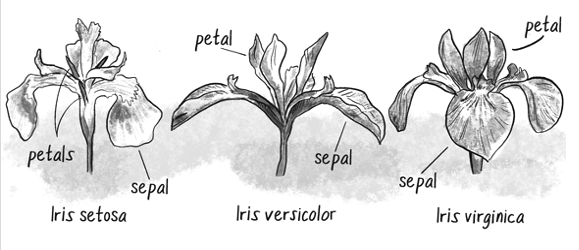
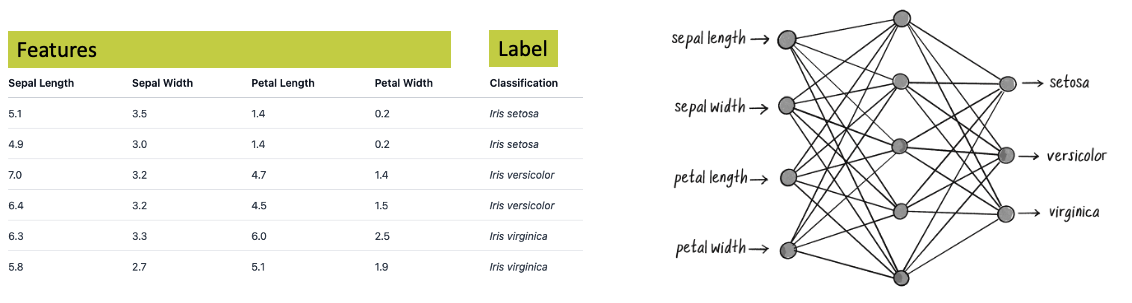
There is a famous data set called Iris. Iris is a flower that comes in three different species, …. The dataset consists of 4 measures from flowers from different species, and in the dataset the species is annotated (label).
If we receive a new set of measures, can we predict the species? We can perform an exploratory analysis to see that, indeed, these measures are quite distintively linked to the species. a neuro network can be designed so to have four input notes (because we have four values to feed). We can add then One or more layers of neurons, and finally we need three output (one per species.)
since we have a little set with a lot of measures it’s wise to split it in two: First part will be used to train the network, which means feeding the data and tuning the weights until the predictions are correct. Then we can use the second half (test set) to check if the mode is able to correctly predict the species, or if we had a case of overfitting (i.e. the model learned by heart the data without finding a pattern)
![]() key aspect: a neural network learns from data presented as vectors (list of numbers) and has a risk of overfitting.
key aspect: a neural network learns from data presented as vectors (list of numbers) and has a risk of overfitting.
![]() read more about the iris dataset, neural networks and even try a Python notebook about iris classification
read more about the iris dataset, neural networks and even try a Python notebook about iris classification
Neural network for digit recognition
In image recognition tasks — like identifying handwritten digits (0–9) — a neural network can be trained to “see” images by first converting them into vectors. Each image is made up of pixels, and we can flatten these pixel values into a long list of numbers (a vector).
This vector becomes the input to the neural network, which then learns to recognize patterns in the pixel data and classify the image into the correct digit.
![]() the excellent tutorial from 3blue1brown (
the excellent tutorial from 3blue1brown (![]() Neural Networks tutorial) will guide you throughout the process of training a neural network, and will even let you experiment with you own handwriting
Neural Networks tutorial) will guide you throughout the process of training a neural network, and will even let you experiment with you own handwriting ![]()