Once we have a table of denoised, chimera-free ASV sequences, we can assign each one a taxonomic identity by comparing it to a reference database. DADA2 uses a k-mer–based naive Bayesian classifier (Wang et al. 2007) implemented in assignTaxonomy().
The function assigns taxonomy from Kingdom down to Genus, returning a confidence bootstrap value for each level. Assignments with low bootstrap support (< 50 % by default) are reported as NA rather than an unreliable label.
6.2 The SILVA reference database
We use the SILVA database (v138), one of the most comprehensive curated 16S/18S rRNA gene databases. We use the formatted training set provided by the DADA2 team:
File
Content
silva_nr_v138_train_set.fa.gz
Kingdom → Genus classifier
NoteSpecies-level assignment
Species-level assignment requires a second, separate reference file (silva_v138_species_assignment.fa.gz). It uses exact matching of the full ASV sequence rather than the Bayesian classifier, and should only be trusted when the amplicon region is discriminating at the species level. We skip addSpecies() in this tutorial because the file is not included in the dataset, but it can be added as a straightforward extra step if needed.
6.3 Run taxonomy assignment
taxa_file<-file.path(path_precomp, "taxa.rds")if(!file.exists(taxa_file)){message("Assigning taxonomy (this may take several minutes)...")taxa<-assignTaxonomy(seqtab.nochim,path_silva, multithread =TRUE, verbose =TRUE)saveRDS(taxa, taxa_file)}else{message("Loading pre-computed taxonomy.")taxa<-readRDS(taxa_file)}
Finished processing reference fasta.
6.4 Inspect the taxonomy table
# Remove sequence row names for readabilitytaxa.print<-taxarownames(taxa.print)<-NULLhead(taxa.print, 10)
The taxa object is a matrix with one row per ASV and one column per taxonomic level. NA values indicate the classifier was not sufficiently confident at that level.
6.5 Classification summary
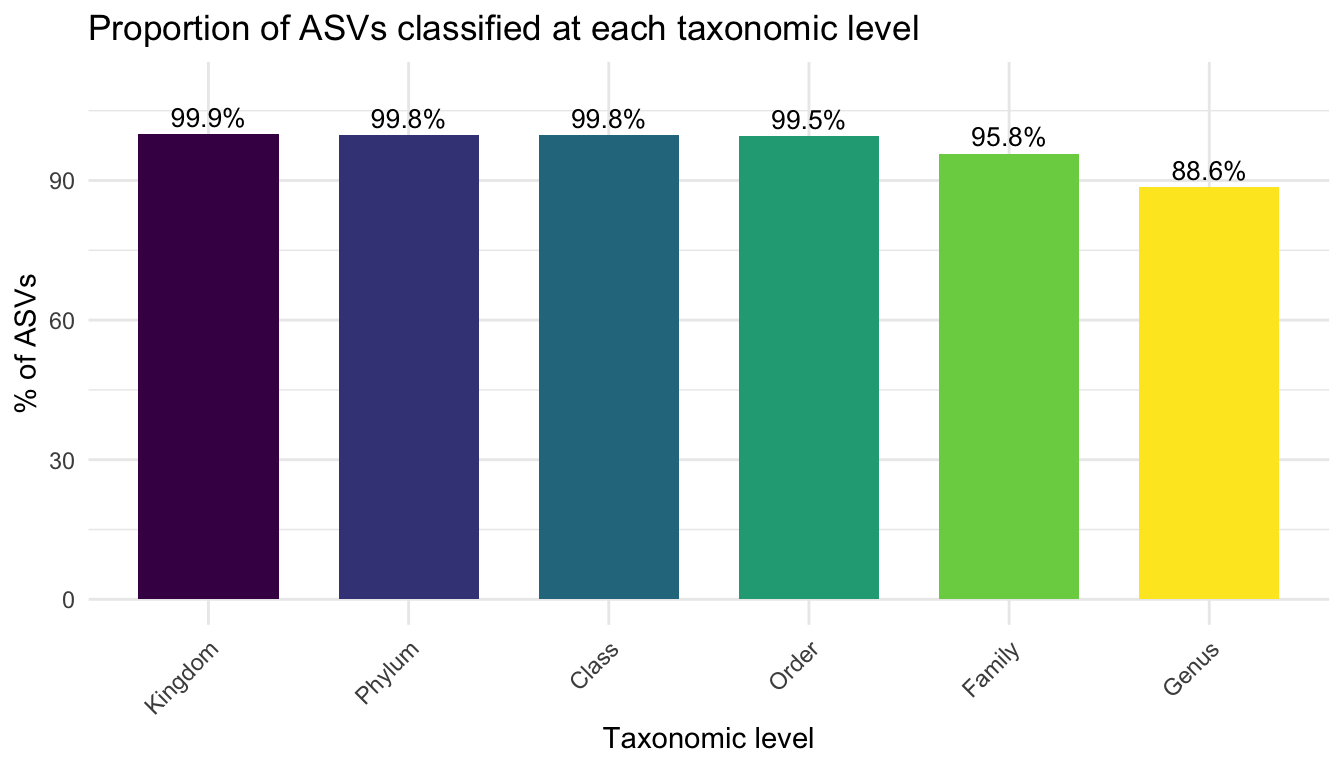
How many ASVs received a classification at each level?
ggplot(classif, aes(x =Level, y =Percentage, fill =Level))+geom_col(width =0.7)+geom_text(aes(label =paste0(Percentage, "%")), vjust =-0.4, size =3.5)+scale_fill_viridis_d()+labs(title ="Proportion of ASVs classified at each taxonomic level", x ="Taxonomic level", y ="% of ASVs")+theme_minimal()+theme(axis.text.x =element_text(angle =45, hjust =1), legend.position ="none")+ylim(0, 110)
TipInterpreting classification depth
Near 100 % classification at Kingdom and Phylum is expected for a clean 16S dataset
Classification depth drops progressively at lower levels (Family → Genus) — this is normal and reflects the limits of 16S resolution
Very low Phylum-level classification (< 80 %) may indicate: non-bacterial sequences, contamination, or a mismatch between the amplified region and the database