Anvi’o, unlike all the other tools we saw so far, is not exclusively a command line tool, but rather a whole ecosystem of tools to analyze and visualize ‘omics data.
It’s composed by:
- a set of command line scripts (more than 100) and
- a powerful interactive interface that can be used to explore your data in a visual way.
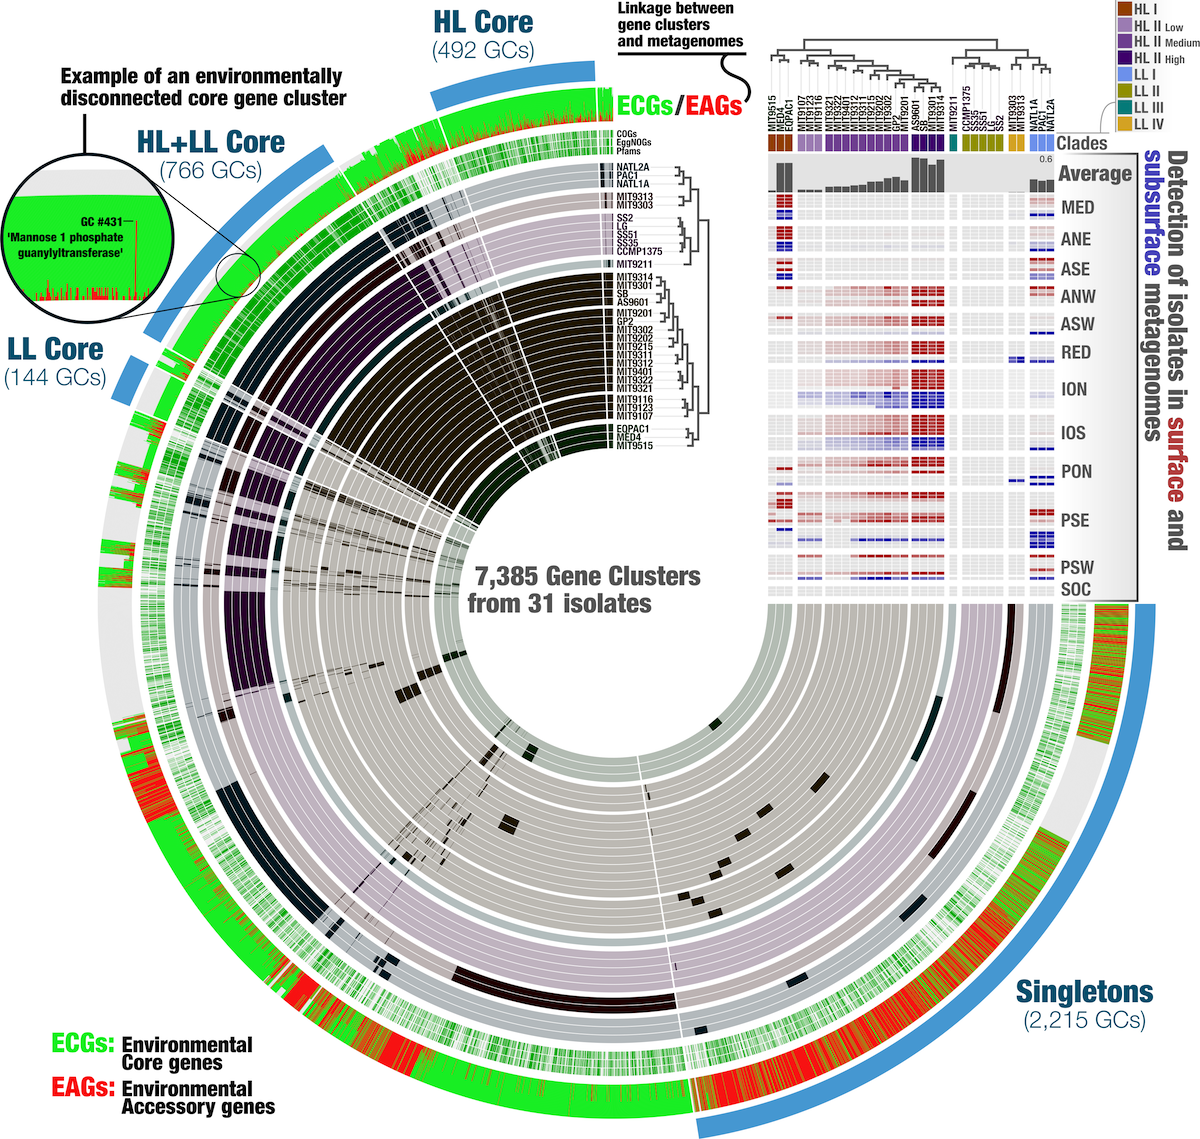
Example of Anvi’o visualization, from Delmont, TO (2018)
Anvi’o is particularly useful for:
- Binning: grouping contigs into putative genomes based on sequence composition and coverage patterns.
- Visualization: creating interactive visualizations of metagenomic assemblies, coverage profiles, and
- Pangenomics: analyzing the gene content across multiple genomes to identify core and accessory genes.
- Functional annotation: annotating genes and pathways in metagenomic datasets.
- Phylogenomics: constructing phylogenetic trees based on genomic data.
The main interface is based on a dendrogram, showing the relations of the tips of the tree. Depending on the analysis, the tips can represent contigs (for metagenomics binning), genes (for pangenomics), or genomes (for phylogenomics).
🛟 Where to find help
- Anvi’o official website has great installation instructions and tutorials.
- Discord server is active and you can ask questions and see previous discussions.
Next submodule:
The interface